Excel, Microsoft Technologies, Power BI

Connect Excel to a Power BI Dataset in a Premium Workspace with a B2B User

Power BI offers the ability for users who have access to a dataset in the Power BI service (PowerBI.com) to connect to the dataset using Excel. Normally, this feature is referred to as Analyze in Excel. Once you connect Excel to your dataset, you can create Pivot Table reports or use Cube Functions.

There are currently limitations that mean this functionality isn’t supported for B2B (external) users. An external user is an Azure AD user that is based in another tenant and has been guested into the local AAD tenant. If you go to your dataset in PowerBI.com. choose Analyze in Excel, and then try to open the downloaded file and connect to the dataset, you will be met with connection errors.

But if you have your dataset in a workspace backed by Premium Per User or Premium capacity, you can use the XMLA endpoint to connect, even if you are using a B2B user!

Instead of using the Analyze in Excel functionality, you can connect to your dataset as if it were Analysis Services, using the XMLA endpoint. B2B users just need to make one adjustment to the server name they enter to make this work.

In Excel, locate the Get Data button. Select From Database and then From Analysis Services.

Get Data menu in Excel with the options From Database and From Analysis Services selected.
Connecting to a Power BI dataset using the XMLA endpoint in Excel is done in a similar manner as connecting to an Analysis Services database

Open a browser window and go to the settings of the Power BI workspace that contains the dataset to which you want to connect.

Settings for a Power BI workspace called Demo Reports.
Power BI Premium workspaces of any kind should have the workspace connection string listed in the settings pane

If your workspace is backed by Premium capacity, you will be able to see this in the settings and the workspace connection will be available for you to copy. If you are a member user (not external) you could copy this info into the Server Name box of the Data Connection Wizard and go on your way.

If you are a B2B user, you need to make an adjustment as noted in Microsoft Docs. You need to replace “myorg” in the workspace connection with your primary domain name. If you have access to the Azure portal, you can find the primary domain name on the overview page for the Azure Active Directory.
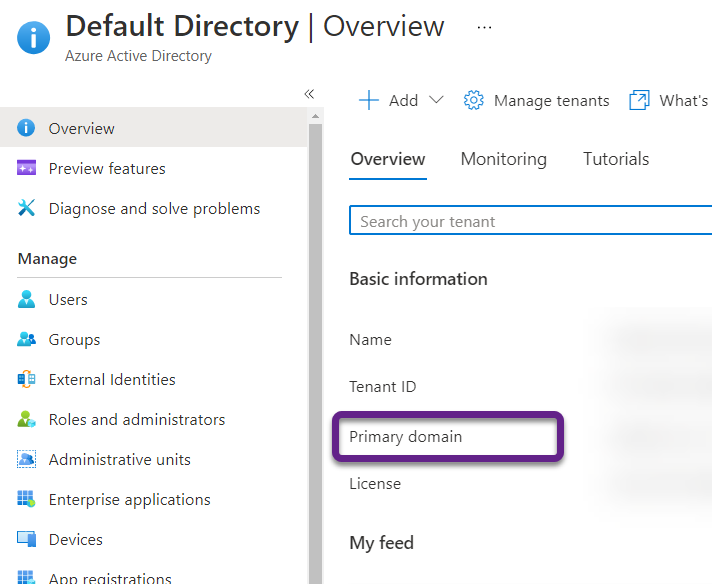
Overview page in the Azure Portal for Azure Active Directory with the Primary Domain circled under basic information.
The tenant UPN, also called primary domain can be found in the Azure Portal on the AAD overview page

So if the workspace connection from the Power BI service is:
powerbi://api.powerbi.com/v1.0/myorg/Demo%20Reports

And your primary domain is:
mysupercooldomain.com

Then you would change the workspace connection to:

powerbi://api.powerbi.com/v1.0/mysupercooldomain.com/Demo%20Reports

Once you have populated the server name with the workspace connection string, change the logon credentials to “Use the following user name and password” but leave the credentials blank. Once you select the Next button, you will be prompted for your Azure credentials.

Then you will be able to select the desired dataset from the workspace and be on your way to making connected Excel reports.

Excel, Microsoft Technologies, Power BI, SSIS

Installing the Microsoft.ACE.OLEDB.12.0 Provider for Both 64-bit and 32-bit Processing

I recently got a new laptop and had to go through the ritual of reinstalling all my programs and drivers. I sometimes work with SSIS locally to import data from Excel and occasionally do demos with Power BI where I read from an Access database so I needed to install the ACE OLE DB provider.  If you try to do either of those things without the ACE OLE DB provider you will get a message like the one below.

The ‘Microsoft.ACE.OLEDB.12.0’ provider is not registered on the local machine.

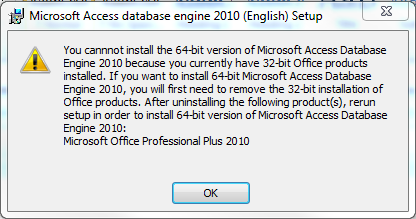
I needed both the 32-bit and the 64-bit adapters to cover my various use cases. I started by installing the 64-bit Microsoft Access Database Engine 2010 Redistributable.  If you have ever attempted this, you know there is a secret. You cannot install the 2010 Access database engine with a different processing architecture (bittedness) from your Office install (or install both versions of the 2010 Access database engine) without a workaround.  If you try, you will get an error message.

ACE engine bittedness error

There are two options for getting the other version installed.

Option A: Install the 2007 Office System Driver: Data Connectivity Components

The 2007 Access database engine can read the same format, but didn’t have a 64-bit install. It doesn’t have the check to see what other products are on your machine and can co-exist peacefully with the 64-bit 2010 Access engine.

Option B: Install from the Command Line and Use the Passive Switch

  1. Open the command prompt.
  2. Type the file path and file name for your Access Database Engine install file.
  3. Follow it with a space and then “/passive” and then hit Enter.
  4. Delete or rename the mso.dll registry value in the following registry key: HKEY_LOCAL_MACHINE\SOFTWARE\Microsoft\Office\14.0\Common\FilesPaths

Note: A helpful commenter has informed me that for Access 2016 the switch is /quiet rather than /passive.

ACE install cmd

I wrote up a document for this a while back for a client, but I can never remember where I put it. So I’m posting this on my blog to make this info easier to find for me as well as you.

Data Visualization, Excel

KCStat Chart Makeover

I live in Kansas City, and I like to be aware of local events and government affairs. KC has a program called KCStat, which monitors the city’s progress toward its 5-year city-wide business plan. As part of this program, the Mayor and City Manager moderate a KCStat meeting each month, and the conversation and data are live tweeted.  I love the program as well as all of the open data available on Data.KCMO.org. But as a data viz enthusiast, I cringe at some of the charts that are tweeted out from KCStat.  I wish that Kansas City would let me fix their charts – or better yet, let me come and teach a data viz class and facilitate a chart makeover session (if anyone from the city of KCMO is reading this, I would gladly donate my time to do this).

This week, a particular chart from KCStat caught my eye.

Story

There is an interesting back story to this chart. KCMO invited citizens to attend Citizen Work Sessions, in which they organized into small groups and played a game to learn about the city budget and provide feedback. In the first scenario of the game, each group was asked to allocate a $100 budget across the city’s five major goals (as laid out in KC’s Citywide Business Plan) without reference to specific programs within the goals. In the second scenario, they were given a total budget of $1000 allocated to match the current city budget and were asked to identify the top 3 – 5 priority programs under each goal and then cut $50 from individual programs (as opposed to just the broad goals).  The chart from the tweet represents the results of the game.

Chart Design

The table shows the starting allocation and the average final allocation after the $50 cut (averaged because multiple groups performed this exercise). The line in the chart is tied to the starting allocation, and there are several markers that show the values assigned by the individual groups  after the budget cut (which would equal the ending final average amount when averaged together).

For me, this chart is ineffective and cluttered.

  • It’s using a line chart for categorical comparisons. With rare exceptions for multivariate analysis, slope charts, and maybe a few other situations, line charts are best used to show trends over time.
  • The markers are all bunched together to the point that they really aren’t useful, especially given the scale of the y-axis and the size of the markers. It would be nice to see the individual markers if there were any dramatic outliers, but that is not the case with this data.
  • The placement of the table in the middle of the chart between the axis labels and the data points is distracting. If you include axis labels rather than directly labeling, it is because you want to allow users to see the scale and follow a label across to a data point. But the line your eyes follow with this chart is interrupted by the big blue table in the middle of the graph.
  • I believe the table column header for “Ending Average Final (after cutting $50m)” is mislabeled. It should be after cutting $50, since we are dealing with only $1000 to begin with. I thought maybe it was accidentally scaled to the city’s real budget amount, but it looks like the Governmental Activities budget is about $953 million so that didn’t make sense.  Either way, it confused me and then I decided it was mistyped. Especially with this kind of subject matter (budgets and government communication to the public), you want to be as clear as possible and review your charts to remove any possible confusion.
  • The data in the chart is the least emphasized thing in the image. The thing that is most eye-catching is the header row of the table or perhaps the graph title due to the use of bold colors.
  • Goal areas are abbreviated in the table and wrapped on multiple lines in the graph x-axis.
  • This chart could really use some context. I had to dig through the presentation and the city’s open data to understand the situation that explains this chart. A few sentences to go with it would have been nice so readers know what they are looking at.

So I decided to take this image and redo it with better design decisions. I ended up with two different versions. I used Excel to create these makeovers. I’m sure I’ll do future makeovers with Power BI or Tableau, but I think Excel worked just fine for this, and is probably what was used to make the original data viz.

Version 1

KCStat Chart Makeover Version 1 (click to enlarge)

First, I added some explanatory text for context to help communicate my message. If you don’t know about the Citizen Work Sessions, this chart might be confusing. The note about the shift in spending to public safety came from the FY 2016 – 2021 Citywide Business Plan. I thought it was important context to note as city council members and government officials have hard decisions to make when it comes to the budget.

So my data viz communicates two things:

  • explains the allocation of budget across goal areas
  • notes that there was a budget cut and shows the impact on the budget and allocation

You’ll notice in this version I used data bars embedded in my table rather than embedding a table inside of my chart.  Microcharts can be a good way to visually represent data while still providing detailed numbers. While tables primarily interact with our verbal system, graphs interact with our visual system to give us a quick picture of how different data points are related. The data bars form a horizontal bar chart, which is a great way to show a categorical comparison. Here I’m comparing the initial budget amount allocated for each goal area. My rows are ordered by descending value of the budget amounts.

Also, because I now have my labels on rows, I have plenty of room to type the full name of the goal area without abbreviating or wrapping.

I added the percent cut data because after seeing the numbers, I immediately start doing the math of (499 – 515)/515 to understand the difference. So I just saved everyone some time and showed it in my table. The absolute numbers are definitely useful, but it’s also important to understand the impact of the cut to each goal. A 16% cut could be devastating to an already small budget. I used conditional highlighting to help emphasize the impact of the cut, so the largest cut has the most intense color.

KCMO didn’t provide the individual data points for the markers, so I couldn’t use the individual data points in my chart makeover. But I think I might have chosen not to show the individual data points anyway because the value that they add is not worth the space they take up in the visualization. And they’re not core to my message. What I’m trying to show is where people generally made cuts when faced with that decision. I don’t have to show all the data points just because I have them.

The strategic use of color draws your eyes to the important parts of the data (the allocation to goals and the effect of the budget cut) rather than the box around the chart tile or the table column header like it did in the original visualization.

Version 2

KCStat Chart Makeover Version 2 (click to enlarge)

I used the same explanatory text in this version. This time, I created a clustered horizontal bar chart and directly labeled the bars, removing the need to show a table. This chart shows me two things: the allocation of the budgets across goals and the and the difference between the original budget and the average budget after cuts. This time I’m not focusing on the impact of the cut to the total budget for the goal, just visually showing where cuts happened and allowing the reader to make the comparison with the bars.

Again,  I switched to a horizontal bar char so I have a good categorical comparison and my labels have plenty of room and don’t have to be wrapped or abbreviated. I put the legend at the top left so you have that information before going to read the chart (our eyes tend to move across the chart in a “z”).

And again your eyes are drawn toward the color first, which is where the important data is located.

Data Visualization Critiques & Makeovers

Feel free to leave comments on how you would improve my chart makeovers. I would appreciate the feedback.

If you like chart makeovers, there are several sites that critique and redesign data visualizations. Here are some of my favorites:


DAX, Excel, Microsoft Technologies, Power BI, Power Pivot

Improving Performance in Excel and Power View Reports with a Power Pivot Data Source

On a recent project at work, I ran into some performance issues with reports in Excel built against a Power Pivot model. I had 2 Power Views and 2 Excel pivot table reports, of which both Excel reports were slow and one Power View was slow. I did some research on how to improve performance to make the reports return results more quickly, and I found some great resources that I’ve compiled here in the hopes that they help you as well.

Purposeful Sorting of Source Queries

Alberto Ferrari suggests that you check the sorting and design of the tables you import into Power Pivot.  It seems that sort order does not significantly affect the final size of the data in Power Pivot, but it can affect performance when querying the model. I believe the goal is to order the columns based upon the number of distinct values ascending. I didn’t see a measurable improvement in querying my Power Pivot model after implementing this, but the benefits realized probably depend a lot on the type and size of your data.

Power Pivot Data Source Tips

André Van de Graaf has a great list of Power Pivot tips on his blog.  My favorites are:

  • Use views to import data from a database.
  • Import only the columns that are useful and analytically relevant.
  • Reduce the number of rows to import by including only those you are going to analyze (e.g.: perhaps you only need the last two years of data instead of five).

I used database views to specify only the columns and rows I needed in addition to performing any calculations that could be done on the row-level data.  Putting the calculation in the SQL view is often more efficient (and easier for DAX beginners) than creating a calculated column in a Power Pivot table.

Query Performance and Slicers

Power Pivot Pro has a good blog post about report performance when using slicers.  It includes some great tips:

  • Avoid using slicers for fields with many distinct values or fields that come from very large (usually fact/measures) tables.
  • Reduce the number of slicers.  If you can’t reduce the number of slicers, consider turning off cross-filtering on the slicers.
  • Reduce the number and complexity of measures.

It turns out that slicers issue 2 queries each: one to get the list of values and one to determine if those values have related data in the connected pivot table(s).  Slicers are a wonderful usability improvement for report consumers, and I think you should use them in place of report filters whenever it makes sense.  But they can slow performance to an unacceptable level. This is why you may need to remove a couple of slicers from a report that has several. Or you might just turn off cross-filtering.  Since the query for the pivot table basically has to be executed to determine which of the slicer values have related data, simplifying the measures and calcs used in your pivot table helps as well.

My Power Pivot model contained sales data by product. Those products were segmented into 3 product categories.  I had a product category slicer in my report for which I turned off cross-filtering.  With only 3 values, the cross-filtering wasn’t as valuable as the performance improvement achieved by turning it off.

Performance Tuning of Tabular Models

I also re-read the white paper on performance tuning SSAS tabular. Some of the suggestions weren’t applicable since I didn’t control the server where the Power Pivot model sits (my workbook was stored in Office 365). But the tips on changing the DAX calculations and the model are helpful:

  • Convert calculations into calculated columns.
  • Avoid error handling functions.
  • Detect filters using optimized functions like HASONEVALUE() and HASONEFILTER() rather than COUNTROWS().
  • Use CALCULATE() instead of FILTER().
  • Decide whether to use ISBLANK() versus ISEMPTY().
  • Use natural hierarchies, if possible.

Calculated columns are computed when the model is processed (refreshed) whereas calculated measures are computed during query execution. So if your queries are slow, you may want to attempt to use a calculated column to simplify a complex calculated measure, which should improve query execution times.

I used HASONEVALUE() in several calculations that dealt with time intelligence. We did a lot of year over year comparisons, so I had formulas to compare a 4 week period to the same 4 week period in the prior year based upon the fiscal calendar.

Qty Sold Last 4 Wks Prior Yr:=if(HASONEVALUE('End Date'[FiscalWeekKey]),
 CALCULATE([Total Quantity Sold], FILTER (ALL ('End Date' ),
 'End Date'[DaySeq] <= MAX ( 'End Date'[dayseqlastyear]) 
 && 'End Date'[dayseq] > Max('End Date'[dayseqlastyear]) - 28)),BLANK())

HasOneValue checks to make sure the row or column in the pivot table where this calculation is used includes only 1 week so that I can be sure I have the correct 4 week period.

This project reinforced the fact that DAX CALCULATE() function is very powerful and usually much faster than FILTER(). I had a few calculations that started out taking minutes to return for a model that had one fact table with about 8 million rows and 3 small dimension tables.  I rewrote the calculations to remove the FILTER() function and just use CALCULATE() with the same criteria in the filter clause, and they returned the correct values in under a second.

Conclusion

In the end, I used a combination of these tips for my project.  The changes that had the biggest impact were:

  • I reduced the number of rows I was importing.  I originally was pulling all data from 1/1/2010 forward, but I changed it to show the current calendar year plus the previous 3 years.
  • I turned off cross-filtering on some of my slicers.
  • I rewrote some calculated measures to use CALCULATE and remove FILTER()

As PowerPivotPro said almost 3 years ago, Slicer cross filtering is very often the #1 source of slowdown. It is still true today, and it will be one of the first places I look when I am faced with performance issues in Excel reports in the future.

Data Visualization, DAX, Excel, Microsoft Technologies, Power BI, Power Pivot, Power View

Color Coding Values in Power View Maps Based Upon Positive/Negative Sign

Power View can be a good tool for interactive data visualization and data discovery, but it has a few limitations with its mapping capabilities.

  • Power View only visualizes data on maps using bubbles/pies.
  • The size of the bubble on a Power View map can be misleading during analysis for data sets with small values and negative values.
  • By default, Power View can only display one measure on a map, which it uses to determine the size of the bubble.

Microsoft offers other mapping capabilities in Power Map and SSRS maps, so if all you need is a map, you can explore those other tools to determine if they better meet your needs. Check out my presentation on Choosing Your Geospatial Mapping Tool for more info on requirements, capabilities, and limitations of maps in Power View, Power Maps, and SSRS. If you want to see a map in the context of other charts, and you want the interactive highlighting and filtering of Power View, you may look for workarounds to the second and third issues listed above.

I recently had a client express disappointment about the display of negative values in Power View maps. A negative value simply gets a small bubble, and positive value gets a larger bubble. You have to hover over the bubbles to see each value and understand the bubble size that represents the change in sign from positive to negative. This gets a little tedious and minimizes the usefulness of the bubble map in the first place. The example Power View map below shows the year over year change in trespassing incidents in my city from 2013 to 2014. The small bubble has a value of -16, and the large bubble to the right has a value of 6.

PV Map Neg Values

One way to better present this type of data in a Power View map is to have positive values represented in one color and negative values represented in another with the bubble sizes showing the absolute value of the change. This proved to be less than straight forward as I worked my way through it. You can’t just make separate measures for the positive and negative values because Power View won’t let you put two measures on a map in that manner. You can’t simply create a calculated measure that determines the sign of your values and put it in the legend because Power View is expecting categorical data for the legend and it won’t let you put the numerical data field in the legend. Power View also doesn’t recognize calculated measures that return a text value (they don’t show up in the field list), so you can’t create a measure that turns the sign into a text value (“Positive” or “Negative”) in an effort to make it more categorical.

But you can use dynamic segmentation to show the second measure as a dimension. There is a great video on MSBI Academy that walks you through this. Although the video shows two different measures on a map, you can use this method to color code positive and negative values of a single measure. First, create a disconnected table for the number sign attributes. It should contain at least:

  • a text field with a descriptor
  • a field for the minimum value of the range
  • a field for the maximum value of the range.

The video shows storing that table in Excel (which is great if you plan to make changes), but you can now also paste the table directly into Power Pivot without any link to the table in Excel. My final table looks like the image below.

PV Map Sign Table

Next you need a calculation that uses the disconnected table and displays the absolute value of the measure you want to use for the bubble size.

Change In Incidents YOY Pos/Neg:=
     if(CALCULATE(Countrows('Sign'),
     FILTER('Sign',[Change in Incidents YOY] >= Sign[Min] 
     && [Change in Incidents YOY] < Sign[Max])
     ),
     abs([Change in Incidents YOY])
     )

Then you can build your map.  Use the Pos/Neg field for color, the new calculation for size, and your location fields of choice.

PV Map Pos Neg 1 Layer

Note that you will now see a warning message in the Power View fields list that relationships may be needed. You can disregard that. The use of a disconnected table is the cause of that message, and everything is working as intended.

PV Rel Msg

If your map has no drill down levels, you can stop here. Your map will now have the values for positive and negative in the legend with bubbles of two colors on the map. A bubble whose signed value is 5 will be the same size as a bubble whose signed value is -5 with the color indicating the sign of the number. In this analysis, a positive number indicates an increase in trespassing, so I chose a theme and ordered my values in the sign table such that the positive values were assigned the brighter color. These are the bubbles that need attention since trespassing is rising in the related zip codes.

If you do have drill down levels in your map, you have a couple more steps. You need another measure that deals with the drill down path. Without this extra step you end up with pies and unexpected values.

PV Map Pos Neg 2 Layer Bad

My map allows the user to drill down from zip code to beat. My new calculation references the top level of my drill down path ([Zip Code]), the calculation I just created ([Change In Incidents YOY Pos/Neg]), and the second level of the drill down path in my map ([Beat]). Note that this calculation is specific to the drill down path used in the map. If you have several maps with different drill down paths, you will need to create several calculations for this to work.

Change In Incidents YOY Pt 2:=
     IF(COUNTROWS(ALLSELECTED('KCPD Crime Data 2014'[Zip Code]))=1, 
     [Change In Incidents YOY Pos/Neg], 
     CALCULATE([Change In Incidents YOY Pos/Neg], 
     ALLSELECTED('KCPD Crime Data 2014'[Beat]))
     )

Now I can put this new measure in place of the original one, and the pies will go away, returning the expected color coded bubbles and values.

PV Map Pos Neg 2 Layers SBS

Excel, Microsoft Technologies, Power View, SSAS

Create a Power View Sheet Connected to an SSAS Tabular Model Without SharePoint

I have created Power View reports based upon SSAS Tabular models many times, but I typically go through SharePoint to get my data connection from a BISM connection file. I am now working on a project where I need to create Power Views connected to a tabular model without using SharePoint.  The way to do this was not immediately obvious to me, so I thought I would share this information. If you click Power View on the Insert Tab, you will get the following message: “Power View needs data to work with. Select a range of cells that contain data and then on the Insert tab click Power View.” Excel is assuming you want to you Power Pivot as your data source.

Instead, add a new data connection to your workbook that points to an SSAS Tabular model.

  1. On the Data tab, Choose From Other Sources -> From Analysis Services.
  2. When the dialog box appears, enter the server name and choose Windows Authentication. Then click Next.
  3. Select the appropriate database and perspective. Click Next.
  4. Update the file name and friendly name, if desired. Click Finish.
  5. Now that you have your data connection in your workbook, an Import Data dialog box will appear. Choose Power View Report and click OK.

A Power View sheet will be created in your workbook.  If you need another Power View sheet:

  1. Go to a regular Excel worksheet (not a Power View sheet).
  2. Click on the Existing Connections button.
  3. Double-click on the appropriate connection in the workbook.
  4. Choose Power View Report. Click OK.

The Office help documentation for this topic is here.

I also made a quick video that shows me creating two Power View tabs connected to an SSAS tabular model in an Excel workbook.

Data Visualization, DAX, Excel, Microsoft Technologies, Power Pivot

Power Pivot: Dynamically Identifying Outliers with DAX

I have been working on a project in which we were looking at durations as an indicator of service levels and customer satisfaction, specifically the maximum duration and average duration. We built a small dimensional data mart in SQL Server to house our data, then pulled it in to Excel using Power Pivot so we could make a few Excel and Power View reports and provide the client with the model for further ad hoc reporting and analysis. After the first iteration of development, we got feedback from the client that there were several outliers that were skewing the metrics. They wanted to see average and max duration for whatever group of objects they had chosen and then see the calculations after removing the top and bottom 5% of values.

Here is a small sample of my fact table, called Object Processing.  Field names and some small details have been changed to protect the innocent.

ObjectKey StatusKey CreationDateKey GeographyKey Duration
1 1 20140501 1 2193218
2 1 20140503 2 2114354
3 2 20140429 3

The first four columns are foreign keys to dimensions. The object dimension contains an object ID, name, owner, and content group. The status dimension contains an ID and description of the current processing status. The date dimension is a standard date dimension representing the date the object was created. The geography dimension contains an ID, country, and region. The duration column represents the number of seconds the object has spent processing. A new row is inserted into the fact table for each object created.

First, I have a few simple DAX calculations. These calculations work great on their own until you need to remove the outliers:

Total duration:= Sum('Object Processing'[Duration])
Avg duration:= Average('Object Processing'[Duration])
Max duration:= Max('Object Processing'[Duration])

To remove the outliers we need to rank the objects by duration. I first read Alberto Ferrari’s blog post on dynamic ranking in Power Pivot. It demonstrates a method to rank items within the table as a calculated column, which didn’t quite work for me because I wanted to dynamically rank items after filters were applied (ex: rank only the objects with a create date of yesterday and a status of completed). Then I found a series of posts on PowerPivotPro.com about Dynamic TopN Reports Via Slicers (parts 1, 2, 3, 4). That was what I needed to work through my similar problem.

First, I created a calculated measure for ranking the objects. If an object had no duration (because it had been created but had not yet reported a duration), I wanted it to be blank rather than rank as the lowest duration. In this formula, I’m ranking Object IDs in descending order based upon my total duration calculation.

Object Duration Rank:=
           if (ISBLANK([Total Duration]), BLANK(),
           RANKX(ALLSELECTED(Object[Object ID]), [Total Duration], ,0))

Next, I needed to identify the top and bottom 5%. First, I counted the total number of objects excluding null durations:

Object Count For Outliers:=
               CALCULATE(DISTINCTCOUNT('Object Processing'[ObjectKey]),
               ALLSELECTED('Object Processing'),
               NOT(ISBLANK('Object Processing'[Duration])))

Then I calculated the number of objects in the top 5%, giving me the rank of the last member of my top outliers group:

Outlier Count:=round([Object Count For Outliers]*.05,0)

To get the rank of the first member of the bottom outliers group I calculated:

Low Outlier Rank:=[Object Count For Outliers]-[Outlier Count]

Finally, I wrote a calculation that determines if the object is in range (not an outlier):

Is In Range:=
               if(ISBLANK([Total Duration]), BLANK(),
               if(Object Duration Rank]>[Outlier Count] && 
               [Object Duration Rank]<[Low Outlier Rank], 1, 0))

Now I could filter my pivot table containing the Is In Range calculation for only those values equal to 1 to see the average and max duration with outliers removed.

Ultimately, I produced a summary report similar to this:Object Duration SummaryWe were able to compare object durations for objects created in the last 1, 7, and  30 days, including and excluding outliers. The conditional highlighting is set so that cells are highlighted if the duration for that time period is greater than the duration for the prior time period listed below it. For example, average object duration for yesterday is 5:06:02, which is greater than the average duration for the last 7 days of 4:54:14.

I’m still working on a DAX calculated measure that will return the average object duration excluding outliers in one fell swoop, rather than needing to filter out the outliers in a pivot table.

Data Visualization, Excel, Microsoft Technologies, Power Map, Power View, SQL Saturday, SSRS

Choosing A Mapping Tool in the SQL Server BI Stack

With the addition of the Power BI suite to the SQL Server BI stack, there are now 3 main options for creating data-driven maps. I have been working on a presentation to help you choose which mapping tool is appropriate for your needs on a given project. I gave the presentation for the first time in SQL Saturday Chicago, and I’ll be presenting it again at the first SQL Saturday – BA Edition in Dallas on May 3. I’ll share the highlights of the information I provide in my presentation in this blog post, and you’ll just have to attend a SQL Saturday where I’m speaking to get the rest of the details.

There are 3 main tools between Excel, SQL Server, and SharePoint that can visualize data on maps:

  • Power View
  • Power Maps
  • Reporting Services

There are also a few apps for Excel 2013 that create maps (Bing Maps, Geographic Heat Maps). I’ll explain the Excel apps in a later blog post, and focus on the more mainstream tools for today. Although you can make maps with each of these tools, there are some significant differences in features, time to delivery, and system requirements for each of these tools. The image below summarizes the pros and cons for each of these tools.

Maps OverviewPower View is the easiest to use, but it has the most limited features. The drag and drop interface allows you to build a map in a matter of minutes. But this ease of use comes at the price of limited customization. The only type of graph you get on a map is a bubble chart, which turns into pie charts if you add a category. You can only build one layer of data on your map. Also, fonts and colors are limited to the themes available within Power View. Power View offers great interactivity and cross-filtering capabilities. You can set up your map so it drills down from country to state to city. You can use slicers and other graphs to filter and highlight data on a map. An example of using a map to filter a related table in Power View can be found here. Power View reports are usually visually appealing and lend themselves well for presentations. And if you are using Power View inside of SharePoint, you can export your Power View to a PowerPoint presentation and retain interactivity.

Power Map’s strongest features are a time axis that enables you to watch trends over time, the ability to show multiple layers at once, and the storytelling capabilities that come from scenes and tours. Power Maps have more choices for graphs, including columns, bubbles, heat maps, and region shading. But there is no drill-down capability to see an increased level of detail. Power Map also lacks the ability to filter data.  For example, if you have sales data for three products and you only want to see sales for Product A, Power Map doesn’t offer a way to filter to just Product A. This means that you may have to add some DAX calculations to your Power Pivot model to facilitate your map creation. DAX has its own learning curve, so this increases the time required to build the map if you have to learn DAX and alter your Power Pivot model first. Update: As of Sept  2014 you now have the ability to filter your data in a Power Map. The great thing about Office365 is that you can get monthly updates.  The inconvenient thing about that is I have to go back and update blog posts when this happens. Power Map can facilitate great storytelling with data through the use of scenes and tours. You can look at a particular geography and time period in each scene and combine scenes into a tour, then you can share that tour to take users on your journey to gain insight.

Although Reporting Services isn’t getting much love from Microsoft’s marketing or engineering groups, it is still a very viable option for creating maps. While SSRS can require more technical expertise and time to deliver a finished product, it allows the most customization of the three tools and offers subscriptions (time-based and data driven) and multiple rendering and export formats. It also allows custom shapes, so you aren’t limited to whatever the Bing Maps API can do. This helps with custom geographical regions within a company or its customers. It also means you can map more than just points on a globe; you can map floor plans and other shapes you can capture with SQL Server spatial data types. Where Power Map and Power View don’t necessarily require a lot of infrastructure to share a report, SSRS reports require a Report Server or SharePoint Server to make a report available to users.

I’ve developed the following high-level categories to be used to evaluate the appropriateness of each tool for your map.

Maps Eval CriteriaI used these evaluation categories to summarize my findings for each tool in the table below. You’ll notice that I split Power View into Power View for Excel and Power View for SharePoint. This is because these two different development environments have some different system requirements, data sources, and methods of consumption for the resulting Power View report. Although there are two different modes of Reporting Services (Native and SharePoint Integrated), this difference only affects system requirements so SSRS was kept as a single category.

Maps SummaryFor system requirements, note that Power View works with Excel 2013 Professional Plus and O365 Pro Plus and a few other versions, but you must have an Office 365 Pro Plus subscription to get the GA version of Power Map.

Although the Power Map release notes state that you can use it with a 32-bit processor, large amounts of data or graphics intensive map layers can slow the computer to halt or cause Excel to crash. If you can help it, it’s best to have a 64-bit computer for Power Map development or consumption in Excel.

You’ll notice that the list of data sources for SSRS is fairly long compared to the other development environments, but don’t let that mislead you. I’m just listing direct data sources. Although Power Pivot only takes up one line, it can connect to a multitude of data sources, and Power Query extends those options even further. SSAS Tabular also has many options for data sources.

Also, be aware that bubble sizing in Power View for small values can be misleading. This issue is compounded by the fact that turning on data labels for a Power View map only labels the location and not the amount related to the size of the bubble.

In my presentation at SQL Saturday Chicago, one of the attendees expressed the opinion that Power Maps tend to be very busy and it’s difficult to tell where to look when you first encounter one.  I don’t disagree with that, so I’ll throw in the warning that it can be very easy to make a Power Map that is visually appealing but doesn’t provide any insight into your data. I think there are some good use cases where Power Map is the best tool to deliver insight, but not every map needs a time axis and multiple layers/multiple graph types. Another limitation of Power Map is that is can only be opened from the Excel file that contains it (there’s no way to view it in a web browser). While I expect that to change in the future, this is the current state today. Outside of exporting a tour to video, the development environment and the viewing environment are one and the same. To create a new Power Map or insert an existing Power Map, you must go to the Insert tab in Excel and choose Map. This will open the Power Map window where you can view and update your map.

I also want to point out that SSRS is the only one of the three tools that can make use of SQL Server spatial data types. If you would like to learn more about spatial data types in SQL Server, Hope Foley has a great presentation on the subject and has her slides and scripts posted on her blog. Jason Thomas has some good blog posts on SSRS maps.

Data Visualization, Excel, Power Map, Power View, SQL Saturday, SSRS

I’m Speaking About Geospatial Data Viz and Data Viz Best Practices in April

I will be speaking at two SQL Saturdays in April.  First, I will be at SQLSaturday #297 in Colorado Springs on April 12.  I’ll be presenting my session on The Accidental Report Designer: Data Visualization Best Practices in SSRS.  See my previous post on this subject to understand why I think it is an important message for all data professionals.  In this session, I share guidance on evaluating the effectiveness of data visualizations and a few good tips and demos to take your data visualizations from chaotic and ineffective to professional and powerful.

Next, I will be at SQL Saturday #291 in Chicago on April 26.  I will be presenting a new session to help you Choose Your Geospatial Mapping Adventure. Here’s the abstract:

You have geospatial data and you know that plotting it on a map will deliver insights. Or maybe you keep hearing “geospatial” as a current BI buzzword and you want to be informed about your options when you get to it. The Microsoft BI stack provides several options for visualizing location data. But how do you know which tool will best serve your purpose, or what factors are important in making this decision? We’ll identify factors to consider when choosing a tool to visualize your data in maps such as system requirements, availability and type of location data, required level of technical understanding, and more. You’ll leave the session confident in your ability to choose the best tool within Excel and SQL Server.

The Microsoft BI stack offers several great options for presenting data on a map, but your decision of which tool (Power View Map, Power Map, SSRS map, free mapping apps in Excel) can limit you in features, accessibility, and time to delivery. Some of the tools require more technical skill than others, but you lose some of the ability to customize when you go with the highest ease of use.  The session will be filled with tips, explanations of features and requirements, and demos.

If you will be in the area on the dates of these events, please stop by to participate in my sessions or just say hello.

Excel, Microsoft Technologies, Power BI, Power Map

Power Map for Excel is Now Generally Available for Office 365 With a Few New Features and Bug Fixes

Today, Microsoft announced that Power Map for Excel is now in GA. As Chris Webb noted, it will only be available for those that have Office 365 ProPlus. Those with standalone Excel or Office Professional Plus will not get the GA version of Power Map. I just finished applying the update to Office to get the GA version and I have a few observations.

Once you have the Office SP1 update, you will need to enable to the GA add-in and disable the preview add-in, as it installs separately from (rather than over the top of) the Power Map Preview add-in.

Enable Power Map Add-in

If you had the Power Map Preview installed, when you go to insert or open a Power Map, you will receive a dialog box that asks you to allow it to uninstall an older version.  This only takes a minute. Then you can open Power Map once again and work with the new GA version.

There don’t seem to be any significant differences between the preview and GA version, but they did fix a few bugs, add a couple of new features,  and make a few UI updates.

Some of the icons in the ribbon have been updated, but the options are still the same.
PM Updated Ribbon icons

If you click on Themes, you will notice there are now 12 themes available where before there were 8.

PM Themes

When you go to add a new layer, you will notice that the Chart Type drop-down was changed to an array of icons.  The available selections remain the same: stacked column, clustered column, bubble, heat map, region.

PM - chart type icons

They have added a new icon to the Layer Manager panel that allows you to add a new layer to the selected scene.

PM added New Layer IconThey also added a new option in the Layer Options to change the opacity of the layer.

PM Layer Option - Opacity

And they fixed the color picker in the Layer Options!  This was awful in the preview, but it looks much better now.

PM - Color Picker worksThey also updated the UI for annotations.

PM - Updated Annotation UI

And, I’m not 100% sure on this one, but I think they added the ability to add line breaks in the text of the annotations (using Shift + Enter).  I seem to remember struggling with the lack of this ability in the preview version.

PM - annotation line breaks

Those are all of the changes I noticed.  Leave me a comment if you see something I missed.  I was able to open and update several maps I made with the Preview version and I haven’t noticed any incompatibilities between the preview and GA versions.

There are still some features that I feel should be included in this product:

  • filter data in the map without having to make lots of calculated measures in Power Pivot to accomplish this
  • show/embed a Power Map on a web page without having to open it in Excel or download/play a video of the tour
  • include images and text in a single annotation
  • choose which fields appear in tool tips/hover text
  • reposition annotations so they don’t overlap with another annotation or a chart item
  • two-color scales for region shading (ex: blue -> red for showing temperature, red – > green for under/over goal)
  • stacked column charts with categories, let the user choose how the items are stacked ex: chronologically asc/desc, alphabetically by category, etc.)
  • create a map from a copy of an existing map

Hopefully some of them will come with the next release.

Happy mapping!