Data Visualization, Microsoft Technologies, Power BI

Design Concepts For Better Power BI Reports – Part 2: Preattentive Attributes

Preattentive attributes are visual properties that we notice without using conscious effort to do so. Preattentive processes take place within 200ms after exposure to a visual stimulus, and do not require sequential search. They are a very powerful tool in your data visualization tool box – they determine what your audience notices first when they look at your Power BI report.

Four preattentive visual properties have been defined:

  • Color (intensity, hue)
  • Form (orientation, line length, line width, size, shape, curvature, enclosure, added marks)
  • Spatial Positioning (2-D position)
  • Movement

Preattentive Attributes in Power BI

Every chart you build in Power BI uses preattentive attributes, but you must make design choices to use them purposefully. Here are some quick examples.

Preattentive Color Length 1
Preattentive Attributes: Color and Length
Preattentive Color Length 2
Preattentive Attributes: Color and Length

The chart on the top uses a different color for each bar and orders the bars alphabetically by product. The chart on the bottom uses a single color across all bars and orders the bars descending by sales amount. Notice how your eyes jump back and forth between the colors in the chart on the top. When you look at the bottom chart, your eyes more easily follow the length of the bars down and across the categories from largest to smallest.

Here’s another example.

Preattentive Orientation Enclosure 1
Preattentive Attributes: Enclosure and Orientation
Preattentive Orientation Enclosure 2
Preattentive Attributes: Enclosure and Orientation
Preattentive Orientation Enclosure 3
Preattentive Attributes: Enclosure and Orientation

The vertical bar chart on the top has a dark black border. It’s probably the first thing you notice about the chart.

Once we remove the border, as shown in the chart in the middle, we notice that the chart category labels have a diagonal orientation. They stand out because nothing else in the chart is diagonal. It’s a bit distracting and difficult to read.

The horizontal bar chart shows the same information in the same order, but allows the category labels to remain horizontal. Now our eyes focus on the information encoded by the bars.

Click here to see these examples in Power BI.

What Does This Mean For Report Design?

We need to take advantage of the way we process information to create a faster and more natural way of acquiring information through our Power BI reports. Specifically, we can use preattentive attributes to highlight the most important parts of a visual and to create a visual hierarchy of information. Color is probably the most powerful preattentive attribute we have at our disposal, so we should use it strategically.

Here are some things you can do to take advantage of preattentive attributes in your Power BI reports:

  1. Reserve the use of bright colors for items that need attention from your users or those that should be examined first, and use less intense colors for other items on the page.
  2. Don’t use multiple colors for the sake of having several colors. For instance, a bar chart with only one field on the categorical axis generally doesn’t need to have separate colors for each bar.
  3. Don’t settle for rotated axis labels when they won’t fit horizontally. Abbreviate categories and numbers, or switch to a different chart type that supports longer labels if you need to do so.
  4. Start bar charts at 0 to allow your users to accurately evaluate length and differences between bars.
  5. Make sure visuals in a row are exactly aligned. If charts in a row are slightly misaligned by a few pixels, it can be distracting.
  6. Don’t let chart title be the brightest/boldest thing on your page. Let your data in your charts, KPIs, and cards draw the most attention. In many cases, you don’t need a background color on your chart titles.
  7. Avoid adding dark, intense chart borders. Try using whitespace to separate charts rather than adding borders.

There are times when chart borders and background colors on chart titles are appropriate. (I’m currently working on a report where I have a border around a group of charts to indicate that they are all related, but it is light gray rather than black.) But they definitely aren’t appropriate all the time, so I suggest your default be to avoid them and add them when necessary.

Sometimes it’s difficult in Power BI to find a chart that will accommodate even slightly long category labels, since the built-in visuals truncate the values on the axis with no setting to change that behavior. I ask that you lend your votes and comments to User Voice to help change that. You can vote here or here. Until that issue is resolved, you might try the Attribute Slicer custom visual. Although it has some formatting quirks of its own, it has a setting to define the portion of the chart that should be taken up by the bars versus the labels.

I have provided several guidelines that are not hard and fast rules. The goal of these guidelines is to help you use color, form, and position to guide your users through your report in an efficient manner, to help them process the information your report provides.

This post is part of a series. Go here to see the list of posts in the series. 

Data Visualization, Microsoft Technologies, Power BI

Design Concepts To Help You Create Better Power BI Reports

I have decided to write a series of blog posts about visual design concepts that can have a big impact on your Power BI Reports. These concepts are applicable to other reporting technologies, but I’ll use examples and applications in Power BI.

Our first design concept is cognitive load, which comes from cognitive psychology and instructional design. Cognitive Load Theory says that when we present our audience with information, we are asking them to use brain power to process it. That brain power (aka working memory) is limited, so we need to be intentional about the information we present to them.

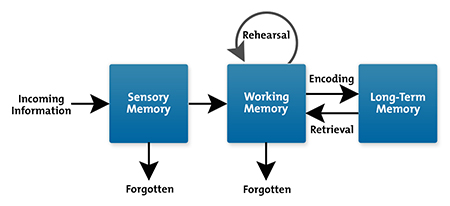
In order to commit information to memory and be able to recall it later, that information must go through sensory memory and working memory and then be encoded into long-term memory.

Image from MindTools Cognitive Load Theory: Helping People Learn Effectively (https://www.mindtools.com/pages/article/cognitive-load-theory.htm)

This process is not automatic nor guaranteed. There is a major constraint imposed upon us in that our working memory can only hold about 4 things at once.

Cognitive load theory identifies schemas, or combinations of elements, as the cognitive structures that make up an individual’s knowledge base. Schemas allow us to treat multiple elements as a single element in order for us to think and solve problems. For schema acquisition to occur, information delivery should be designed to reduce working memory load. Cognitive load theory is concerned with techniques for reducing working memory load in order to for our minds to build new schemas.

Cognitive load can be categorized into three types:

  • Intrinsic cognitive load refers to the complexity of the information itself.
  • Extraneous cognitive load refers to the way the material is presented.
  • Germane cognitive load is the effort a person must expend to learn and build new schemas.

What Does This Mean For Report Design?

We need to design such that our audience can efficiently take in the information we are visualizing, commit that information to memory, and use that information to make decisions. This means we should be aware of our audience and their existing knowledge of the information we are presenting. It also means reducing extraneous cognitive load by keeping our design simple and clutter free.

Here are some things you can do to minimize cognitive load in your Power BI report:

  1. Choose a message/purpose for your report and don’t allow anything on the canvas that can’t be tied back to that message. We can’t just say we are building a financial dashboard for our company and put all of our financial metrics on the page. We need to choose which metrics are important and which ones go together in meaningful chunks.
  2. Create charts that take into account your audience and how they think about the subject of your report. If your audience might not know how to approach the subject matter of your visualization, you may need to add supplemental information (either in the report or as links) so they can begin to build schemas to help them think about the subject. If your audience has existing knowledge, use their terminology and approach to thinking about the subject as much as possible so they are building upon what they know.
  3. Remove clutter. Eliminate things from your report that do not make the information memorable. This could include removing decorative elements that do not support information intake (this doesn’t mean remove all color and images, just extraneous ones that distract more than help). Make sure you aren’t using super intense colors everywhere, which makes your report feel busy and makes it difficult to know where to look first. Also, remove redundant information. If you are direct labeling your charts, you probably don’t need gridlines and axis labels. Descriptive chart titles often eliminate the need for axis titles.
  4. Use consistent designs as much as possible, so users don’t have to refer to a guide for each new report you build. This can be applied by putting slicers in a similar location across reports, or using the same color for revenue in reports that show multiple metrics. This removes the cognitive burden of learning how the report works so users can focus on the information in the report.

In addition to paying attention to actual cognitive load, we should also think about perceived cognitive load – how much effort our users think it will take to consume our report. Our users are constantly being distracted by coworkers and children and cell phones, and Dog Rates. They have limited time and energy to consume our reports. If the report looks busy and complicated, or extremely aesthetically unpleasing, they may perceive that the task is not worth the effort and move on without looking at the report we spent hours building. Remember that we are designing for a specific audience, and it is their information needs and their perception of our report that matters more than our own design preferences.

This post is part of a series. Go here to see the list of posts in the series. 
Biml, Microsoft Technologies, SSIS

Biml for a Task Factory Dynamics CRM Source Component

I recently worked on a project where a client wanted to use Biml to create SSIS packages to stage data from Dynamics 365 CRM. My first attempt using a script component had an error, which I think is related to a bug in the Biml engine with how it currently generates script components, so I had to find a different way to accomplish my goal. (If you have run into this issue with Biml, please comment so I know it’s not just me! I have yet to get Varigence to confirm it.) This client owned the Pragmatic Works Task Factory, so we used the Dynamics CRM source to retrieve data.

I was ultimately creating a bunch of packages that looked like the below.

There are two pieces to using the Task Factory Dynamics CRM Source: the source component and the connection manager. The code for both is below.


<!– This goes in your data flow as the source –>
<CustomComponent Name="TF Dynamics 365 <#=table.Name#>" ComponentTypeName="PragmaticWorks.TaskFactory.DynamicsSource" Version="1" ContactInfo="Dynamics Source;Pragmatic Works, Inc; Task Factory (c) 2009 – 2016 Pragmatic Works, Inc; http://www.pragmaticworks.com;support@pragmaticworks.com&quot; UsesDispositions="true">
<Annotations>
<Annotation AnnotationType="Description">Extract data from Microsoft Dynamics CRM.</Annotation>
</Annotations>
<DataflowOverrides>
<OutputPath OutputPathName="Dynamics Source Output">
<!– Iterate through the columns (I'm passing in table and column from another file), ignoring any audit columns you may have added to your table. Set the Error Row Disposition and Truncation Row Disposition. –>
<# foreach (var column in table.Columns.Where(c => !c.Name.Equals("AuditETLLogID") && !c.Name.Equals("AuditInsertDate"))) { #>
<Column ErrorRowDisposition="NotUsed" TruncationRowDisposition="NotUsed" ColumnName="<#=column.Name#>" />
<# } #>
</Columns>
</OutputPath>
</DataflowOverrides>
<CustomProperties>
<CustomProperty Name="DebugMode" DataType="Boolean">false</CustomProperty>
<CustomProperty Name="FilterQuery" DataType="String"></CustomProperty>
<CustomProperty Name="BatchSize" DataType="Int32" Description="The maximum number of records to retrieve per round trip to the dynamics server">500</CustomProperty>
<CustomProperty Name="FetchMode" DataType="Int32" TypeConverter="PragmaticWorks.TaskFactory.Components.Sources.Dynamics.DynamicsSource+FetchModeEnum, PragmaticWorks.TaskFactory.Components130, Version=1.0.0.0, Culture=neutral, PublicKeyToken=47acf905d0337c39" Description="How will data be retrieved from the entity. Name or Xml Query?">0</CustomProperty>
<CustomProperty Name="Entity" DataType="String" SupportsExpression="true" Description="Name of the entity to retrieve data from"><#=table.Name#></CustomProperty>
<CustomProperty Name="QueryXML" DataType="String" SupportsExpression="true" Description="The XML Query">&lt;filter type="and"&gt;&lt;/filter&gt;</CustomProperty>
<CustomProperty Name="Get Changes" DataType="Boolean" SupportsExpression="true" Description="Get the changes for an entity">false</CustomProperty>
<CustomProperty Name="Changes Token Variable" DataType="String" SupportsExpression="true" Description="The variable that will contain the tracking changes token."></CustomProperty>
</CustomProperties>
<OutputPaths>
<OutputPath Name="Dynamics Source Output">
<OutputColumns>
<!– Add your columns here –>
<# foreach (var column in table.Columns.Where(c => !c.Name.Equals("AuditETLLogID") && !c.Name.Equals("AuditInsertDate"))) { #>
<# if (column.DataType == System.Data.DbType.Int32) { #>
<OutputColumn
Name="<#=column.Name#>"
ExternalMetadataColumnName="<#=column.Name#>"
ErrorOrTruncationOperation="Conversion"
ErrorRowDisposition="FailComponent"
TruncationRowDisposition="FailComponent" />
<# } else if (column.DataType == System.Data.DbType.String) { #>
<OutputColumn
Name="<#=column.Name#>"
Length="<#=column.Length#>"
DataType="<#=column.DataType#>"
ExternalMetadataColumnName="<#=column.Name#>"
ErrorOrTruncationOperation="Conversion"
ErrorRowDisposition="FailComponent"
TruncationRowDisposition="FailComponent" />
<# } else if (column.DataType == System.Data.DbType.Guid) { #>
<OutputColumn
Name="<#=column.Name#>"
DataType="Guid"
ExternalMetadataColumnName="<#=column.Name#>"
ErrorOrTruncationOperation="Conversion"
ErrorRowDisposition="FailComponent"
TruncationRowDisposition="FailComponent" />
<# } else if (column.DataType == System.Data.DbType.Double) { #>
<OutputColumn
Name="<#=column.Name#>"
DataType="Double"
ExternalMetadataColumnName="<#=column.Name#>"
ErrorOrTruncationOperation="Conversion"
ErrorRowDisposition="FailComponent"
TruncationRowDisposition="FailComponent" />
<# } else if (column.DataType == System.Data.DbType.Currency) { #>
<OutputColumn
Name="<#=column.Name#>"
DataType="Currency"
ExternalMetadataColumnName="<#=column.Name#>"
ErrorOrTruncationOperation="Conversion"
ErrorRowDisposition="FailComponent"
TruncationRowDisposition="FailComponent" />
<# } else if (column.DataType == System.Data.DbType.Boolean) { #>
<OutputColumn
Name="<#=column.Name#>"
DataType="Boolean"
ExternalMetadataColumnName="<#=column.Name#>"
ErrorOrTruncationOperation="Conversion"
ErrorRowDisposition="FailComponent"
TruncationRowDisposition="FailComponent" />
<# } else if (column.DataType == System.Data.DbType.DateTime) { #>
<OutputColumn
Name="<#=column.Name#>"
DataType="DateTime"
ExternalMetadataColumnName="<#=column.Name#>"
ErrorOrTruncationOperation="Conversion"
ErrorRowDisposition="FailComponent"
TruncationRowDisposition="FailComponent" />
<# } } #>
</OutputColumns>
<ExternalColumns>
<!– Add your columns here –>
<# foreach (var column in table.Columns.Where(c => !c.Name.Equals("AuditETLLogID") && !c.Name.Equals("AuditInsertDate"))) { #>
<# if (column.DataType == System.Data.DbType.Int32) { #>
<ExternalColumn
Name="<#=column.Name#>" />
<# } else if (column.DataType == System.Data.DbType.String) { #>
<ExternalColumn
Name="<#=column.Name#>"
Length="<#=column.Length#>"
DataType="String" />
<# } else if (column.DataType == System.Data.DbType.Guid) { #>
<ExternalColumn
Name="<#=column.Name#>"
DataType="Guid" />
<# } else if (column.DataType == System.Data.DbType.Double) { #>
<ExternalColumn
Name="<#=column.Name#>"
DataType="Double" />
<# } else if (column.DataType == System.Data.DbType.Currency) { #>
<ExternalColumn
Name="<#=column.Name#>"
DataType="Currency" />
<# } else if (column.DataType == System.Data.DbType.Boolean) { #>
<ExternalColumn
Name="<#=column.Name#>"
DataType="Boolean" />
<# } else if (column.DataType == System.Data.DbType.DateTime) { #>
<ExternalColumn
Name="<#=column.Name#>"
DataType="DateTime" />
<# } } #>
</ExternalColumns>
</OutputPath>
</OutputPaths>
<Connections>
<!– Do not change Name of DYNAMICSCONNECTION –>
<Connection Name="DYNAMICSCONNECTION" ConnectionName="TF_DynamicsCRM" />
</Connections>
</CustomComponent>
<!– This goes in your environments file or elsewhere, just including to keep this with the source component –>
<CustomSsisConnection Name="TF_DynamicsCRM" CreateInProject="true" CreationName="DynamicsCrmConnectionManager" ObjectData="&lt;DynamicsConnectionManager
ConnectionString=&quot;UseProxy=False;UseConnectionSharing=False;ServerType=3;CRMVersion=4;OrganizationName=MyOrgName;ProxyHost=;ProxyPort=0;ProxyUser=;ReuseSameConnection=False;ServerHost=disco.crm.dynamics.com;ServerTimeout=60;ServerUser=Myuser@domain.com;&quot;&gt;
&lt;ServerPassword
Sensitive=&quot;1&quot; xmlns=&quot;www.microsoft.com/SqlServer/Dts&quot;
p4:Salt=&quot;mOECnMOaUg==&quot;
p4:IV=&quot;Y91tUjUbZZk=&quot;
xmlns:p4=&quot;www.microsoft.com/SqlServer/SSIS&quot;&gt;DxApS7rkG1qIrWFNXW7lVxhP1NCf5ERQLLuBUoIgh+0Qq2h3j8EltnVddZLUKDcYTisgAp5dUICR827d5VaHqsn2Q2SbWB2Q2XVL5pzd38/E4j+vds1beozDzD10OLdXxql11vCvEE0=&lt;/ServerPassword&gt;
&lt;/DynamicsConnectionManager&gt;"/>

Things to note for the source component:

  •  This is pulling data for an entity in Dynamics 365. If you were to populate this by hand, the Task Factory UI would ask you which entity. There are several entities that are visible, but do not allow you to retrieve the data. You can find a list of internal entities here.  You won’t want to stage data from those tables. I generated all of my packages at once with Biml, using a Blacklist to exclude the internal entities.
  • The entity name that should be the value on line 21 is the entity logical name.
  • I’m iterating through columns in tables in a separate file and holding them in memory, hence the references to Table.columns. You’ll need to write some code to get the entity metadata to feed that, or find another way to provide the table names and column names and data types.
  • You must set the ErrorRowDisposition and TruncateRowDisposition to “NotUsed” as I did on line 10 for each column or your package will not work.
  • In OutputColumns and ExternalColumns collections, I just have if statements to check data types. There may be a more elegant way to do this, but this worked for me and I went with it. Feel free to leave suggestions in the comments if you have a better idea.
  • The Connection element on line 145 should keep the name “DYNAMICSCONNECTION”. If you change it, the connection won’t work. In my actual project, my connection manager is in a separate file and is named “TF_DynamicsCRM”. You can set the ConnectionName property to whatever you want, as long as it matches your connection definition (Line 153 in the gist).

Things to note for the Connection Manager:

  • I tried reverse engineering the connection manager in Biml Studio, and that got me close, but it didn’t get the ObjectData property quite right. I ended up having to create one manually, view the code for it in SSDT, and copy it into my Biml file. I have my packages and project set to EncryptSensitiveWithPassword, which is why you see the p4:Salt value on line 158. Your connection manager will have different values for lines 158, 159, and 160. If you set your project to EncryptSensitiveWithPassword, this value will stay consistent across developers. But if you use EncryptSensitiveWithUserKey, the value may change, which will be fun for regenerating with Biml. So make sure you plan for that if you have multiple developers or multiple computers on which you are working.
  • This connection manager is set to connect to Dynamics 365, hence the ServerHost=disco.crm.dynamics.com. If you have an on-prem or hosted environment that isn’t 365, you’ll have to find the correct ServerHost value and put it in line 165.

I hope that helps someone looking to generate the Task Factory Dynamics Source with Biml.