Conferences, PASS Summit, Power BI

Update On My PASS Summit Feedback

Back in June, I posted the feedback I received on the abstracts I submitted to PASS Summit 2016. I wasn’t originally selected to speak, but I did have one talk that was selected as an alternate. It turns out that a couple of speakers had to cancel , and I am now speaking at PASS Summit.  PASS contacted me two weeks ago to ask if I could fill in. Luckily, my session that was chosen as an alternate was one that I give frequently at SQL Saturdays so it was feasible to get it ready to present at PASS Summit.

I am excited and honored to be speaking at PASS Summit, but I’m not stressed about it. Part of it is that I’ve only had two weeks to stress, and part of it is that I have quite a bit of experience speaking and I feel confident that I can deliver a decent (if not downright good) session. I’m still updating my presentation and practicing the delivery in preparation for this week, but I feel comfortable with the process of preparing. I’ve spoken at PASS Summit and many other conferences and user groups over the last five years. Over that time I have developed a process for preparing to speak, which includes building and editing the presentation as well as some disaster recovery measures. Once I have checked all the boxes I can feel that I have sufficiently prepared. It doesn’t mean everything will go perfectly, but it helps make sure I haven’t forgotten anything.

There are a couple of things I hope you take away from this.

  1. If you are selected as an alternate, it is a real possibility that you will be added to the schedule. This worked out nicely for me because I was already scheduled to be at PASS Summit and my presentation was already in a fairly finished state. You will definitely never be chosen if you never submit. So if you are interested, throw your hat in the ring next year.
  2. Giving a good presentation (and feeling confident about it) takes practice. If you are just beginning your speaking efforts in the SQL community and you are nervous about it, know that it gets easier (for most people) as you gain more experience. If you enjoy it, keep putting yourself out there. Speaking is something I thoroughly enjoy these days, and I have (mostly) conquered the nerves. Some of that is because I have experienced failures in presentations and the world did not end. Some of that is the result of my presentation prep checklist, which helps me feel prepared.

The downside of the last-minute addition is that I haven’t had as much time to market my session. So if you like Power BI, data visualization, or Kansas City BBQ, and you are attending PASS Summit, I invite you to join me on Friday morning at 8 am in room 3AB. I’m discussing how to apply good data visualization practices in Power BI using data on BBQ restaurants.

Here’s the description for the session I’m presenting:

Overcoming Chartaphobia with Power BI

Do reports in your organization consist mostly of giant tables of data? Perhaps you have gotten as far as adding KPIs or conditional highlighting to the tables. Maybe you have charts, but they are hideous and distracting. Although tables of data presented as reports are commonly found in many organizations, they may be doing you and your users a disservice. We’ll discuss why cognitive psychological studies tell us that graphs and pictures are more effective at communicating trends and comparisons and how to prepare to create good data visualizations. Then we’ll explore how to employ purposeful data viz designs to help users achieve their goal of making informed decisions, using a fun and useful Power BI dashboard. You’ll leave with guidance on how to take boring or unreadable tables of data and turn them into useful and visually appealing reports. 

I hope to see you in my session on Friday!

Microsoft Technologies, SSAS, SSIS

Process Compatibility Level 1200 SSAS Tabular Model from SSIS 2014

A client wanted to upgrade their SSAS model to SSAS 2016 to take advantage of some of the features of the new level 1200 compatibility model. But they weren’t yet ready to upgrade their SSIS server from SQL 2014. This presented a problem because they had been using the Analysis Services Processing Task to process their tabular model nightly. This processing task in SSIS 2014 uses the old Analysis Management Objects, which aren’t compatible with the new SSAS tabular models.

Attempting to use the AS Processing Task results in the following error: “[Analysis Services Execute DDL Task] Error: This command cannot be executed on database ‘MySSASDB’ because it has been defined with StorageEngineUsed set to TabularMetadata. For databases in this mode, you must use Tabular APIs to administer the database”

The reason for keeping SSAS processing in an SSIS package was because it kept consistent logging throughout their data refresh process. So we set out to find another solution.

The new SSAS Tabular models use Tabular Model Scripting Language (JSON) rather than XMLA. A simple process full command in TMSL might look like:

{
  "refresh": {
    "type": "full",
    "objects": [
      {
        "database": "MySSASDB"
      }
    ]
  }
}

Just pasting the JSON to process the model into an Analysis Services Execute DDL Task didn’t work. It returned the error “DDL is not valid”.

I asked around and received a couple of solutions that worked.

Option 1 (my less preferred option): Create an OLEDB connection manager (rather than MSOLAP) and use an Execute SQL Task.

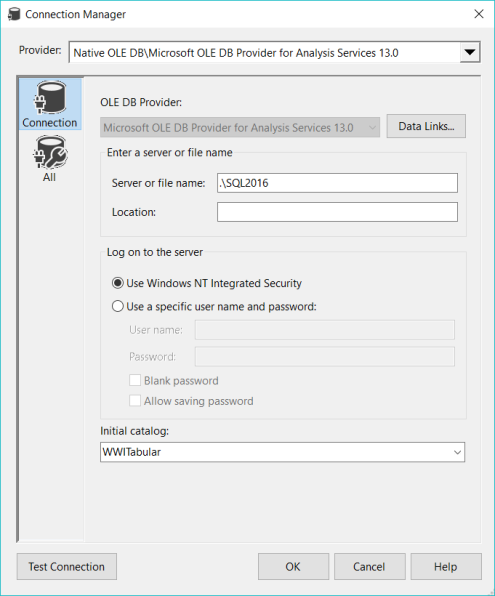
You can set up an OLE DB connection that looks like the below.  Create a new connection manager and choose the OLE DB connection manager type. Change the provider to Microsoft OLE DB Provider for Analysis Service 13.0 and fill in your connection information.

ms-oledb-provider-for-as-conmgr

You’ll see the connection manager show up in the Connection Managers pane looking like this:

ssas-oledb-prov

Drag in an Execute SQL task, use the previously defined connection manager and paste in the JSON. This works just fine, but feels a bit too much like a workaround rather than a solid solution to me.

Option #2: Use an Analysis Services Execute DDL task and wrap the JSON in XMLA

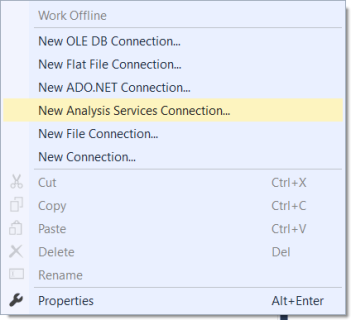
Drag in an Analysis Services Execute DDL task. Create a new connection manager by choosing New Analysis Services Connection.

ssis-new-ssas-con

Edit your connection information, click OK, and you will end up with a connection manager that looks like this:

ssis-ssas-con-mgr

Use that connection manager in the AS Execute DDL task. We can use the same JSON from earlier and wrap it in XMLA as shown below.

<Statement xmlns="urn:schemas-microsoft-com:xml-analysis">
{
  "refresh": {
    "type": "full",
    "objects": [
      {
        "database": "MySSASDB"
      }
    ]
  }
}

</Statement>

The XMLA/JSON command can be a direct source statement or placed in a variable and referenced from the task.

To test that the model is successfully processed, you can execute the SSIS task or package and then run the following query against the DMV.

Select [catalog_name], [date_modified], [compatibility_level] 
from $SYSTEM.DBSCHEMA_CATALOGS where [Catalog_Name] = 'MySSASDB'

So if you are caught between versions in SSIS and SSAS, do not despair. You can still process your new SSAS Tabular model from an SSIS package.

Microsoft Technologies, Power BI, Power Pivot, Power Query, SSAS

Documenting your Tabular or Power BI Model

If you were used to documenting your SSAS model using the MDSchema rowsets, you might have noticed that some of them do not work with the new tabular models. For example, the MDSCHEMA_MEASUREGROUP_DIMENSIONS DMV seems to just return one row per table rather than a list of the relationships between tables.

Not to worry, though. With the new compatibility level 1200 SSAS Tabular models came some new DMVs. They are, unfortunately, not documented at this time (as of 3 Oct 2016). I expect them to show up here at some point in the future. Until then I published a Gist that provides a list of those views as well as some notes on what kind of useful info is in each one. While there are 36 TMSCHEMA DMVs, the main DMVs you will want to check out for model documentation purposes are:

  • TMSCHEMA_COLUMNS
  • TMSCHEMA_MEASURES
  • TMSCHEMA_MODEL
  • TMSCHEMA_RELATIONSHIPS
  • TMSCHEMA_TABLES

There are a few fields that show IDs rather than descriptions (e.g., ExplicitDataType in TMSCHEMA_COLUMNS, Type in TMSCHEMA_DATA_SOURCES). I’ve been able to figure out the descriptions that correspond to some of the values, but I’m still missing a few.

As with the MDSCHEMA DMVs, the TMSCHEMA DMVs can be used to document your model. This also works with Power BI models. You’ll just need to change the connection information to your Power BI instnce while the .pbix file is open in Power BI Desktop. For more information analyzing your Power BI model, see Chris Webb’s post. Since DMVs require DMX queries, you are somewhat limited in your ability to join the data from the DMVs together. This makes it necessary to store the data somewhere before transforming and merging them. Since I needed to document a tabular model for a client, I created a Power Pivot model in Excel 2016. You can download my documentation model here.  My example model was connected to a quick demo SSAS model I made based upon the Wide World Importers DW database.

My Power Pivot Model

My Power Pivot model uses Power Query to import the data from the DMVs. This enables me to merge data into a model that I feel makes the most sense and doesn’t suffer from too many relationships and hidden tables (which is what would happen if you just imported the results of each DMV query into the model). In order to make this work for any model, I employed a trick I learned from Chris Webb to avoid duplicating connection information across queries. I built my model with the normal embedded connection strings and then converted them to use the connection Connection Info tables. As I did that, I ran into a Power Query limitation as evidenced by the error message below.

“Formula.Firewall: Query ‘QueryName’ (step ‘StepName’) references other queries or steps and so may not directly access a data source. Please rebuild this data combination.”

Ken Puls has a great explanation of how to get around this issue. Basically, you have to redesign your queries so that you have “staging tables”, which you can then use to build finalized tables. This redesign gets you around the error since the finalized tables don’t have the embedded source connection, just a reference to the results from another query.

This Excel file documents:

  • Database and model info
  • Tables and source queries
  • Columns
  • Hierarchies
  • Measures
  • KPIs
  • Security roles, membership, and permissions
  • Relationships
  • Perspectives and the columns, hierarchies, and measures they contain

The Database Info tab uses cube functions to display the values shown. The rest of the tabs use pivot tables and slicers.

You can download and use this model if you have Excel 2016 or 2013 with Power Query. Just download the file, change the values in the TabularInstanceName and TabularDBName queries, and refresh. I was able to open the file and update the queries with no issues and no changes in Excel 2013.

This is great if you just need documentation or a quick way to look up specific information. But we could really analyze this using visualizations other than tables in Power BI Desktop.

My Power BI Model

I imported the Excel model into Power BI, made a few adjustments, and then added some visualizations. This report is a bit paired down from a visualization standpoint compared to the Excel file because I eliminated some of the data that wasn’t analytically relevant for me.

Click here to view this report in Power BI.

On the first page, I have several summary numbers that tell me about the contents of the model. It gives me a decent idea of the size and complexity of the model.

tabular-doc-summary

The second page uses a bar chart as an interactive filter against a list of table source queries and columns.

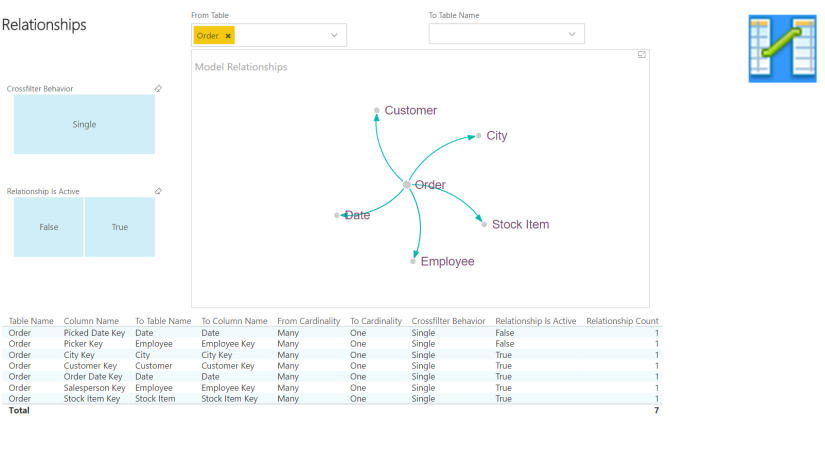
The third page shows relationships between the tables. Slicers on the left filter both the force directed graph and the table. Smart filters at the top of the page let you filter the Table and To Table in the relationships.

tabular-doc-relationshipsThe fourth page shows the details behind each measure. A column chart at the bottom provides a count of measures by table and whether the measure is hidden, which acts as another interactive filter.

The last page shows security by role and table, again using column charts as interactive filters.

Check out the Demo Day video I made on the BlueGranite blog for further explanation and a demo of the Tabular Model documentation.

Update 19 Sep 2017: I have turned the Power BI report into a Power BI Template for easier use. You can download it here