
Things are once again exciting in Microsoft BI. SQL Server 2016 CTPs are available, and Microsoft is promising even more goodness to come as 2016 nears GA. In addition, Power BI has expanded over the last year and is constantly releasing new features. The Power BI team does a good job blogging about new updates. But new features are coming out so fast it can be hard to keep up. There are weekly updates to the web service (PowerBI.com) and what appear to be monthly updates to the desktop app and mobile apps. Sometimes we get the surprise of multiple updates to different parts of the Power BI suite in one week, or even one day. I have frequently found myself trying to remember if a feature is available on the web or desktop app or both. And I have wondered a few times if a feature that was mentioned as coming soon has been made available yet.
Since it’s part of my job to stay on top of the latest Power BI features and capabilities (and because I like lists), I decided to keep a list of the features released for easy reference. It’s much more convenient for me to have a single place to reference when I’m discussing specific capabilities and updates with clients and colleagues. I’m now sharing my list with you.
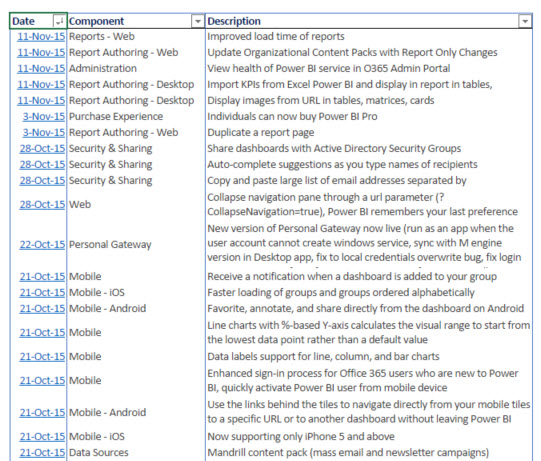
The list contains the date the feature release was announced with a link to the related Power BI team blog post. It also contains the category I assigned to the update, to help you focus on the types of features that interest you most. And it has a short description of the update. You should be able to sort and filter the list right on the page since it’s an embedded Excel Online document.
I’ll try to keep this list updated at least weekly, but feel free to let me know if I’m missing any updates. If you haven’t checked out Power BI in a while, this list shows how it’s rapidly changing and improving. You might find that Power BI is now worth another look.
2 Comments