Have you ever wanted to filter a visual by selecting a range of values for a measure? You may have found that you cannot populate a slicer with a measure. But you can do this another way.
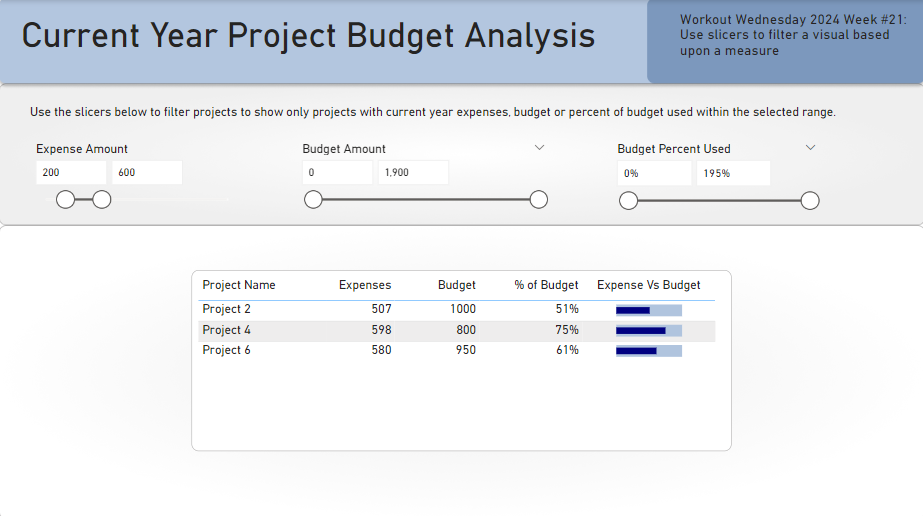
I have a report that shows project expenses and budgets. I want users to be able to filter the list of project to only those which have expenses within my selected range. I also have 2 other slicers for project budget and percent of budget used, but let’s just focus on the expense amount slicer.

To achieve this, I first need to create a table that contains a column with values I can use to populate the slicer. You can do this by creating a numeric range parameter, creating a calculated table in DAX, or by creating a table in Power Query. I chose the Power Query route. Here is the M code I used to create a table that has values from 0 to 1900 incrementing by 1.
let
Source = List.Generate(() => 0, each _ < 2000, each _ + 1),
#"Converted to Table" = Table.FromList(Source, Splitter.SplitByNothing(), null, null, ExtraValues.Error),
#"Renamed Columns" = Table.RenameColumns(#"Converted to Table",{{"Column1", "Amount"}})
in
#"Renamed Columns"
I put the Amount column created in this new table in the Fields list for my slicer and make sure the style is set to “Between”.
I make the table visual as normal, so it shows all projects to start. Then I create a new measure.
Selected Projects - Expenses =
var _expensemin = COALESCE(Min('Range - Expense'[Amount]), CALCULATE(Min('Range - Expense'[Amount]), ALL('Range - Expense')))

var _expensemax = COALESCE(max('Range - Expense'[Amount]), CALCULATE(max('Range - Expense'[Amount]), ALL('Range - Expense')))

var _result = CALCULATE(COUNTROWS('Dim Project'), Filter('Dim Project', [Expenses] >= _expensemin && [Expenses] <= _expensemax))

return _result
This measure gets the min and max expense amounts selected in the slicer, and then filters the projects to those with expenses (based upon a measure called [Expenses]) within the selected range.
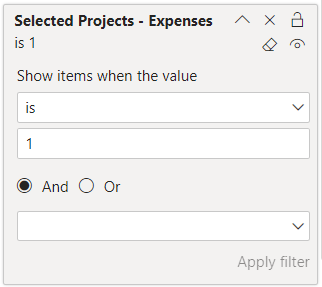
Next I add the [Selected Projects – Expenses] measure to the table visual filters, and set the filter value to 1.

Now, when I set my Expense Amount slicer to the range of 200 to 600, we can see that only 3 projects are shown out of the total 6.

As you can see in my report, I have three slicers used to filter measures. I added another measure that checks all three ranges and if the project matches all three ranges, it returns a 1; otherwise it returns blank. I used a similar visual-level filter with this measure.


Hi Meagan…great post, I learned some new things. Question: the blog post notes that the [Selected Projects – Expenses] measure was added to the filters. Maybe I’m overlooking something here…in the solution file for 2024 Week 21, it appears that [Selected Project – Count] is the filter. Not sure I’m seeing this correctly or what difference it makes using this different measure. Thanks for the clarification.
Hi, Jen. This blog post covers the basics of how a single slicer works. In the WOW exercise, there are 3 slicers, so I created a measure that handles the all 3 slicers in one measure, which is the project count measure you are referencing. It all works the same way.
Hi Meagan,
Nice post! I’m curious how did you set up the lipstick chart inside the table visual. Is it a sparkline?
Thanks and happy dashboarding!
The lipstick chart is an SVG. I took a template from Kerry Kolosko and adapted it for my needs. https://kerrykolosko.com/portfolio-category/svg-templates/. You can download the PBIX for my file at https://community.fabric.microsoft.com/t5/Data-Stories-Gallery/2024-Week-21-Power-BI-Use-a-Slicer-to-Filter-a-Visual-Based-Upon/td-p/3940103.
Hi, I have found your post as I am searching to solve a similar problem.
I am a bit confused on how you treat the measure: if I understand it correctly, as it contains a “countrows”, it can return any number depending on how many records satisfy the min and max conditions ( should be 3 in your example?). So why then do you set the filter as 1?
As I explained in the last paragraph, my DAX in the blog post was how to do 1 measure filter. Then, I updated my measure to return 1 if all three criteria matched. Basically, something like
var _result = If(_expfilter + _budfilter + _percentfilter = 3, 1, BLANK())