It can be tedious to check what visual interactions have been configured in a Power BI report. If you have a lot of bookmarks, this becomes even more important. If you do this manually, you have to turn on Edit Interactions and select each visual to see what interactions it is emitting to the other visuals on the page.
But there is a better way!
Listing visual interactions
You can use a a bit of Python in a Fabric notebook and the Semantic Link Labs library to return the list of modified interactions in a DataFrame. I take it one step further and also check for visuals that are not the target of any modified interactions.
For this to be useful, you have to understand that the default interactions are to cross-highlight or cross-filter where available. For instance, if you have a column chart that shows average student grades by subject and a bar chart that shows average grade by student, when you select the Science subject on the column chart, it will cross-highlight the bar chart so you can see how the student’s science grade compares to their total average. If you don’t like that interaction, you can change it. You can make it filter so you only see the science grade without the total in the background. Or you can configure it so there is no interaction and the bar chart is not cross-filtered or cross-highlighted.
The report definition is in JSON, and if you change no interactions from the default, interactions will not all be specifically listed. But if we change an interaction, we would see that change in the JSON.
Code walkthrough
If you aren’t using an environment with Semantic Link Labs already installed, you must do that first as shown below..
%pip install semantic-link-labsHere I import and alias the report module from Semantic Link Labs as well as pandas.
# Imports
import sempy_labs as labs
from sempy_labs import report

import pandas as pd
Next I need to create a report wrapper for the report in which I want to review the interactions.
var_rpt = '<insert item GUID here>'
var_ws = '<insert workspace GUID here>'
var_rptw = labs.report.ReportWrapper(
    report=var_rpt, workspace=var_ws,readonly=False
)
The main function used here is the Semantic Link Labs list_visual_interactions function, which gets the list of modified interactions.
var_rptw.list_visual_interactions()If you just use that function, you will get a DataFrame with the following columns.
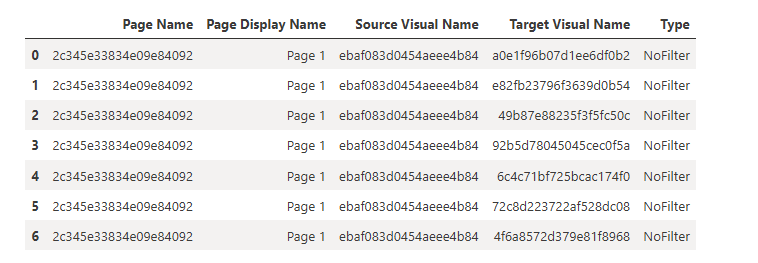
Pages have display names, but visuals don’t. The title we see on visuals in Power BI Desktop is just a property and is not returned by this function. So if you know your report well, you might be able to determine what things are by the GUID (or use Visual Studio Code to view the JSON and locate the visual, but we can make this better with a little more code.
The list_visuals function provides more info about each visual, so if we merge (join) the dataframes containing the list of visuals and the list of modified interactions, we get something more useful.
var_reportname = labs.resolve_report_name(
    var_rpt, workspace=var_ws
)
df_visuals = var_rptw.list_visuals()
df_visuals = df_visuals[[
    'Page Name', 'Visual Name', 'Display Type', 'X', 'Y', 'Z', 'Width',
    'Data Visual'
]]
df_interactions = var_rptw.list_visual_interactions()
df_visualinteractions1 = pd.merge(
    df_interactions, df_visuals, left_on='Source Visual Name',
    right_on='Visual Name', how='inner'
)
df_visualinteractions = pd.merge(
    df_visualinteractions1, df_visuals, left_on='Target Visual Name',
    right_on='Visual Name', how='inner'
)
df_visualinteractions = df_visualinteractions.drop(
    columns=[
        'Page Name_y', 'Visual Name_x', 'Data Visual_x', 'Page Name_x',
        'Page Name_y', 'Z_x', 'Z_y', 'Visual Name_y'
    ]
)
df_visualinteractions = df_visualinteractions.rename(
    columns={
        'Display Type_x': 'Source Display Type', 'X_x': 'Source X',
        'Y_x': 'Source Y', 'Width_x': 'Source Width',
        'Display Type_y': 'Target Display Type', 'X_y': 'Target X',
        'Y_y': 'Target Y', 'Width_y': 'Target Width',
        'Data Visual_y': 'Target Is Data Visual',
        'Type': 'Interaction Type'
    }
)
var_newcolumnorder = [
    'Page Display Name', 'Page Name', 'Interaction Type',
    'Source Visual Name', 'Source Display Type', 'Source X', 'Source Y',
    'Source Width', 'Target Visual Name', 'Target Display Type',
    'Target Is Data Visual', 'Target X', 'Target Y', 'Target Width'
]
df_visualinteractions = df_visualinteractions[var_newcolumnorder]
df_visualinteractions = df_visualinteractions.sort_values(
    by=['Page Display Name', 'Source Visual Name', 'Interaction Type']
)
display(df_visualinteractions)
I narrowed down the column list for the visuals to only the ones I felt were helpful. The list of interactions contains a source visual (the visual emitting the interaction) and a target visual (the visual receiving the interaction). I merge the visual interactions with the visuals twice, so we can get info on both the source and target visuals. After merging, I dropped some columns and renamed others, then reordered the remaining columns to make it easier to understand. And finally, I sorted the values by page, then visual, then interaction type.
This results in the following table.
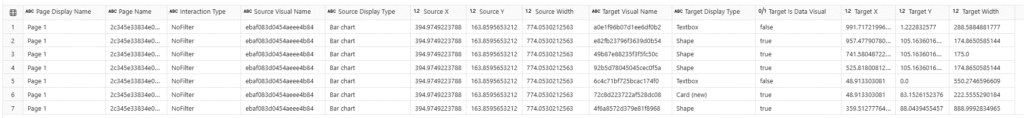
Now I can see what page the visuals are on, which type of interaction they have, what type of visual is used for the source and target, and where the source and target are located on the page.
I can also check which visuals have no modified interactions.
df_nochangedinteractions = df_visuals[
    ~df_visuals['Visual Name'].isin(
        df_visualinteractions['Target Visual Name']
    )
]
print(
    'The following visuals are not the target of any modified '
    'interactions:'
)
display(df_nochangedinteractions)
Here, I take the full list of visuals and return any visual that is not listed in the target visuals in the table above. This returns the following table.

In my report, which uses the default size (1280 x 720), I have a large bar chart that is somewhat near the top of the page and about 1/3 of the way into the page. All the interactions of other visuals with this bar chart use the default interaction settings.
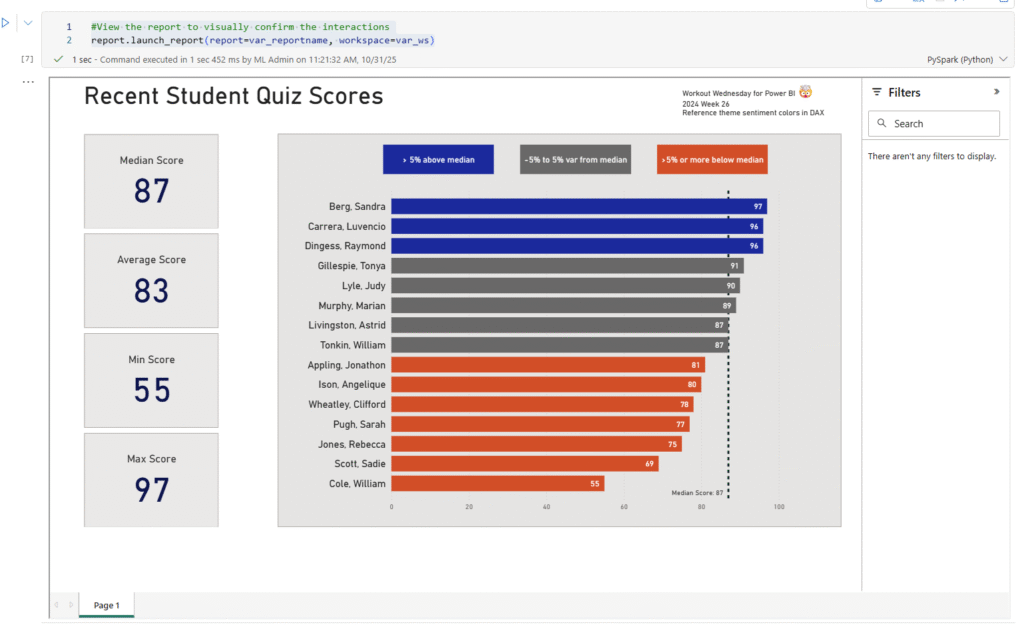
And if I run this last line of code, I can validate that by interacting with the report directly in my notebook.
#View the report to visually confirm the interactions
report.launch_report(report=var_reportname, workspace=var_ws)
This adds a report viewer window containing the fully interactive report in the cell results area. By interacting with the report, I can confirm that I have turned off all interactions from the bar chart to other visuals.
More posts about Semantic Link Labs
So far, I’ve been exploring the report and admin subpackages of Semantic Link Labs. Below are some other blog posts I’ve written about them.
Finding fields used in a Power BI report in PBIR format with Semantic Link Labs
Get Power BI Report Viewing History using Semantic Link Labs
Modify Power BI page visibility and active status with Semantic Link Labs
Happy reading!